The Needle Was in the Red on July 22. Seven Weeks Later, It Still Is.
A barometer does not predict the storm. It tells you how far the pressure has fallen. On July 22 the board read the oil market as a supply story. Here is what the dated record says now.
Lindsay Hiebert, Founder · September 10, 2026 · 3 min read
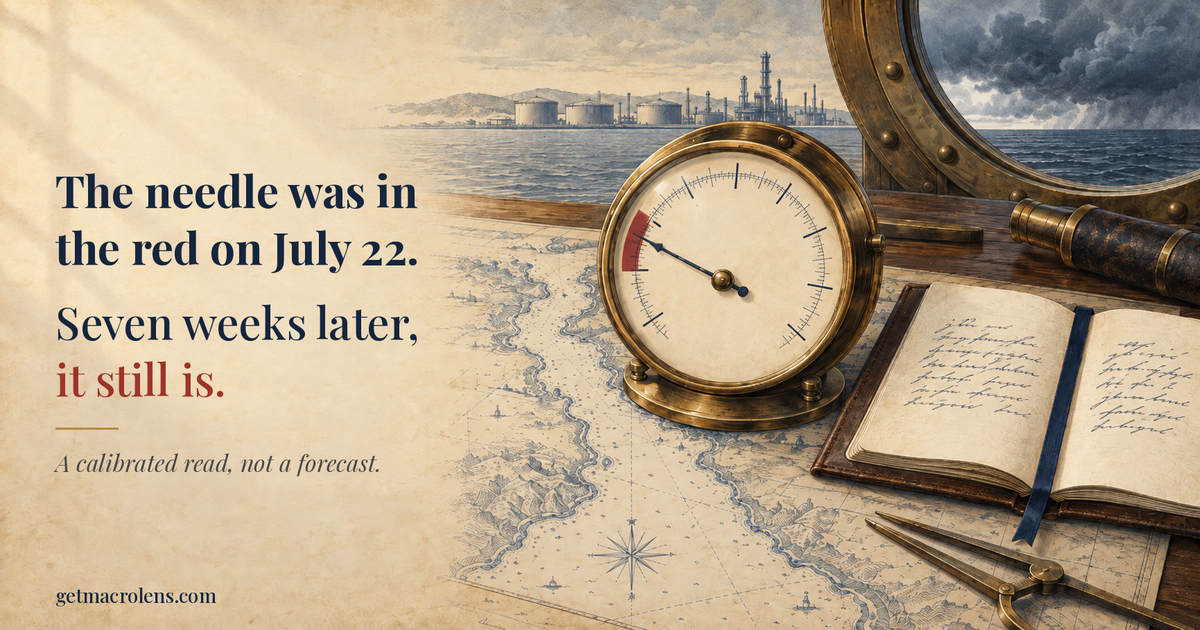
A barometer does not predict the storm. It tells you how far the pressure has fallen.
That is what I built Macro Lens to do for investors.
On July 22, I published a read on the oil market. Most of the talk at the time was about demand destruction. My argument was that demand was not the story. The supply system was. Two sensors on the board were already red that morning: refining margins at extreme levels, and oil storage at Cushing, Oklahoma, the main U.S. hub, down near the minimum the tanks can operate at. Brent itself had been trading above its own 200 day trend since July 13. At the time, crude futures were pricing a coming surplus.
Seven weeks later, here is the picture.
Both sensors are still red. Refining has held extreme for 51 trading days, and Cushing has sat near its minimum for 13 straight weekly reports. Brent is still above its trend. The supply shock sensor, which flipped to stressed on July 21, stepped back once and has been stressed again since August 12.
Brent crude averaged $91 in August, $7 above July, and settled above $100 this week, a level it had closed above only once since May.
The EIA estimates global oil inventories have fallen about 400 million barrels this year and expects them to keep falling.
Over the past month, energy stocks rose about 8.5% while the S&P 500 slipped about 1.4%.
The sensors did not predict this week's escalation in the Gulf. My July post listed it as an open question. What they measured was how little cushion the system had if it came. That is a calibrated read: what the data says today, in plain English, without a forecast and without the drama.
Getting that read has usually required a Bloomberg terminal at about $32,000 a year, or an economist on staff. Macro Lens reads thirteen sensors from free public data every morning and explains what they mean.
The daily brief is free for any investor, anywhere. Three sensors are free to read with a free sign-in. PRO members see all thirteen with their full dated history, and on the days the headlines get loud, they can ask the Should I worry? tool for a calm answer grounded in the same data.
I have not found another free daily brief that reads the physical oil system alongside credit, rates and the dollar this way. I believe that is what AI for good looks like in finance.
The record, with dated links. The July post: Demand Destruction Is Real. It's Also Not the Story. · The board that morning: the July 22 brief · Today's brief: getmacrolens.com/today · Each sensor's flip history is linked from the board.
Sources for the figures above: EIA Short-Term Energy Outlook, September 9, 2026 (Brent averaged $91 per barrel in August, $7 above July; global inventories down about 400 million barrels so far this year, with further draws forecast through year end). Brent settles are front-month ICE Brent futures closes; the September 9 settle was $101.21, and the only close above $100 between May 22 and this week was July 23. Energy stocks and the S&P 500 are measured on the closes of August 10 to September 9 (the Energy Select Sector fund and the S&P 500 fund). Sensor states and days held are the live Macro Lens board as of September 10, 2026.
Macro Lens is a financial publication, not investment advice. Past performance does not guarantee future results.
Get the five-minute brief every weekday morning.
Free, forever. Calm by default — plain English, no jargon, no urgency.
Macro Lens is a financial publication, not investment advice. Nothing herein is a recommendation to buy or sell any security. The methodology is published and reproducible from public data.