Demand Destruction Is Real. It's Also Not the Story.
The correct, checkable read on oil — and why most of the market has been reading one layer of a four-layer story.
Lindsay Hiebert, Founder · July 22, 2026 · 8 min read
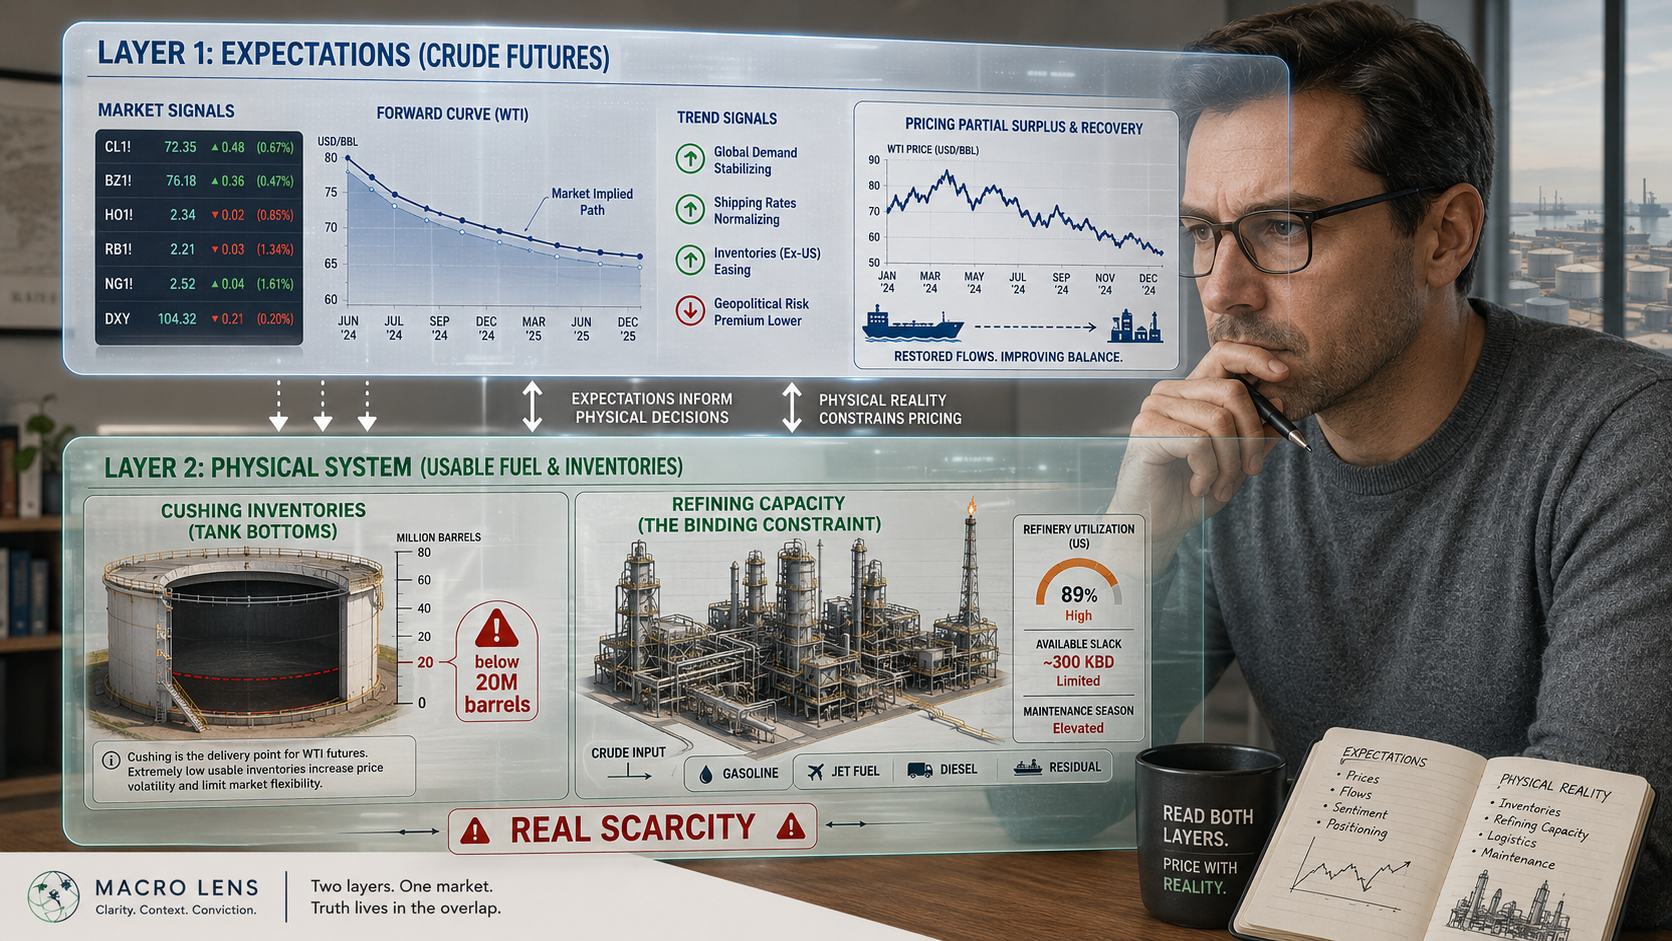
All year, one phrase has done the rounds among self-directed investors: will demand destruction really happen to oil? It gets asked as if it were a riddle, and answered — depending on who's talking — with either a shrug or a theory about who is secretly steering the market.
It is neither a riddle nor a conspiracy. It is a question with a checkable answer, and right now the public record is unusually clear. So here is that answer — with every claim labeled by what it actually is: an observed fact, a supported interpretation, or an open question. That labeling is not decoration. It is the whole method. Facts are checkable. Interpretations must trace to facts. Open questions stay open until the data closes them.
Hold onto that discipline. By the end, it is the entire point.
Observed facts — the record anyone can verify
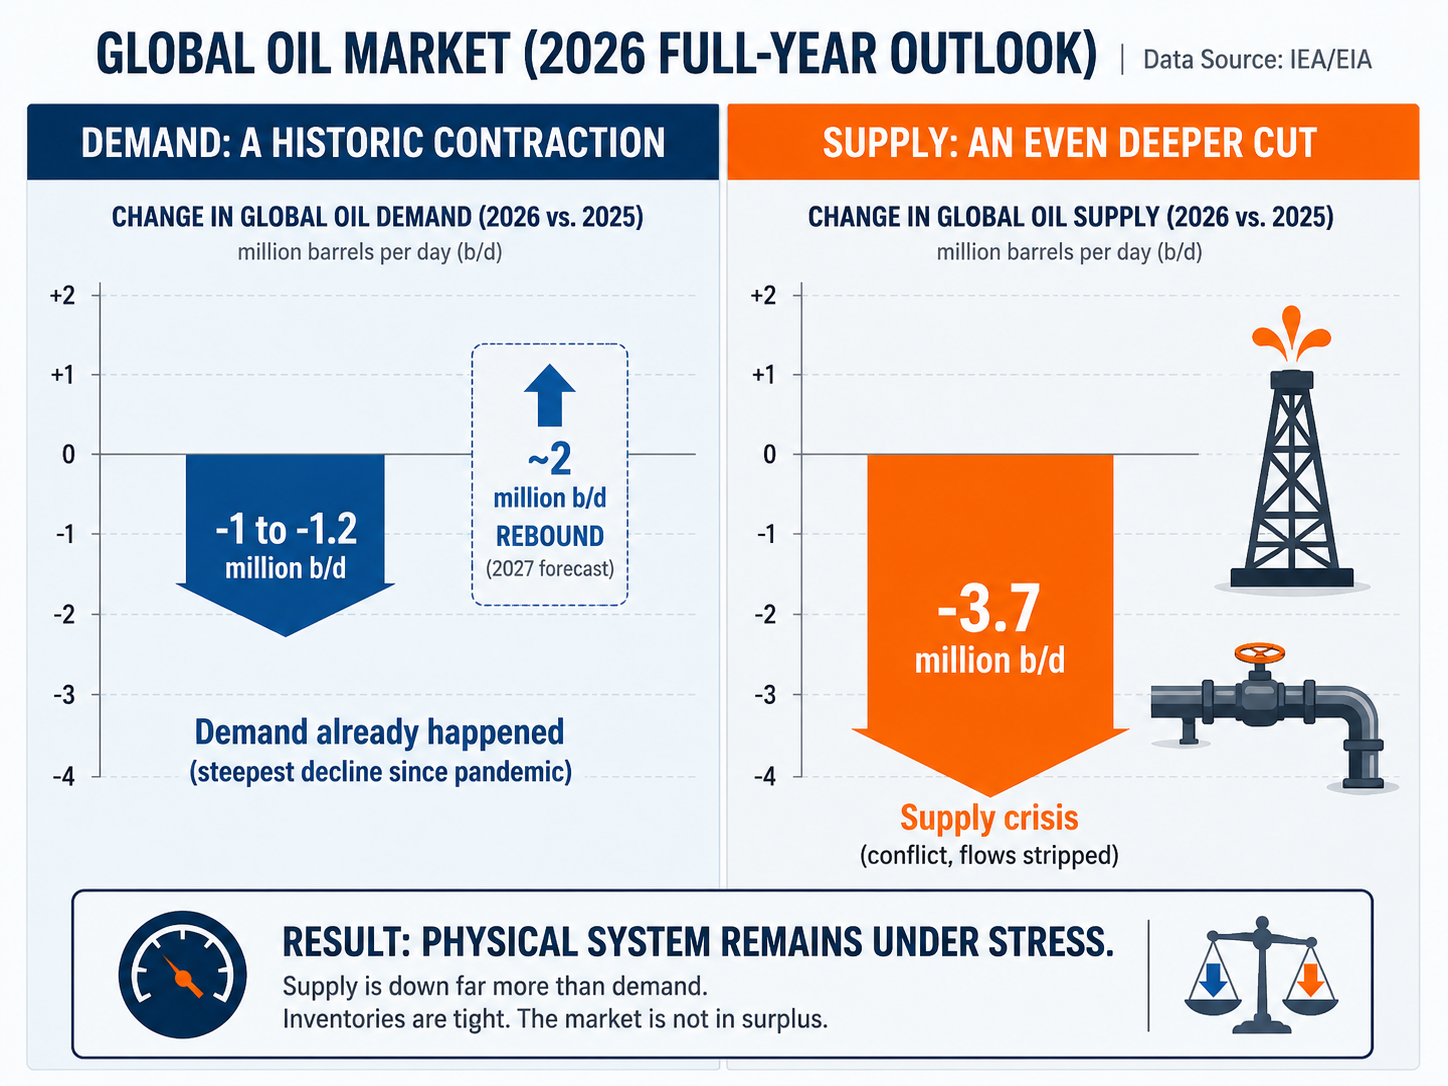
Demand destruction already happened. The IEA measured global oil demand contracting 4.8 million barrels a day, year over year, in the second quarter — the steepest drop since the pandemic — and projects a full-year 2026 decline of about 1 million b/d, the first annual contraction since 2020. The EIA's July outlook is nearly identical: down 1.2 million b/d this year.
And it is already reversing. Both agencies forecast a roughly 2 million b/d rebound in 2027 as flows normalize and prices ease. The contraction ran deepest in Q2, eases through Q3, and demand returns to growth by the final quarter of this year. The same agencies that measured the destruction do not believe most of it is permanent.
Supply fell harder than demand. The IEA called this year's conflict the worst oil supply crisis on record — more than 14 million b/d stripped from global crude flows at the peak. Full-year supply is projected down about 3.7 million b/d, several times the size of the demand decline.
The physical system showed real stress — with dates attached. Cushing inventories sat below 20 million barrels from the week ending June 19 through July 10 — close enough to operational minimums that the EIA published a formal explainer on July 16 about "tank bottoms," the volume below which storage simply cannot function, and warned that reported inventory may overstate deliverable barrels. The Strategic Petroleum Reserve sits near 316 million barrels — its lowest since 1983. And the spot Brent–WTI spread briefly went negative in late June and early July — WTI trading above Brent for the first time since January 2022 — because barrels physically deliverable at Cushing carried a scarcity premium.
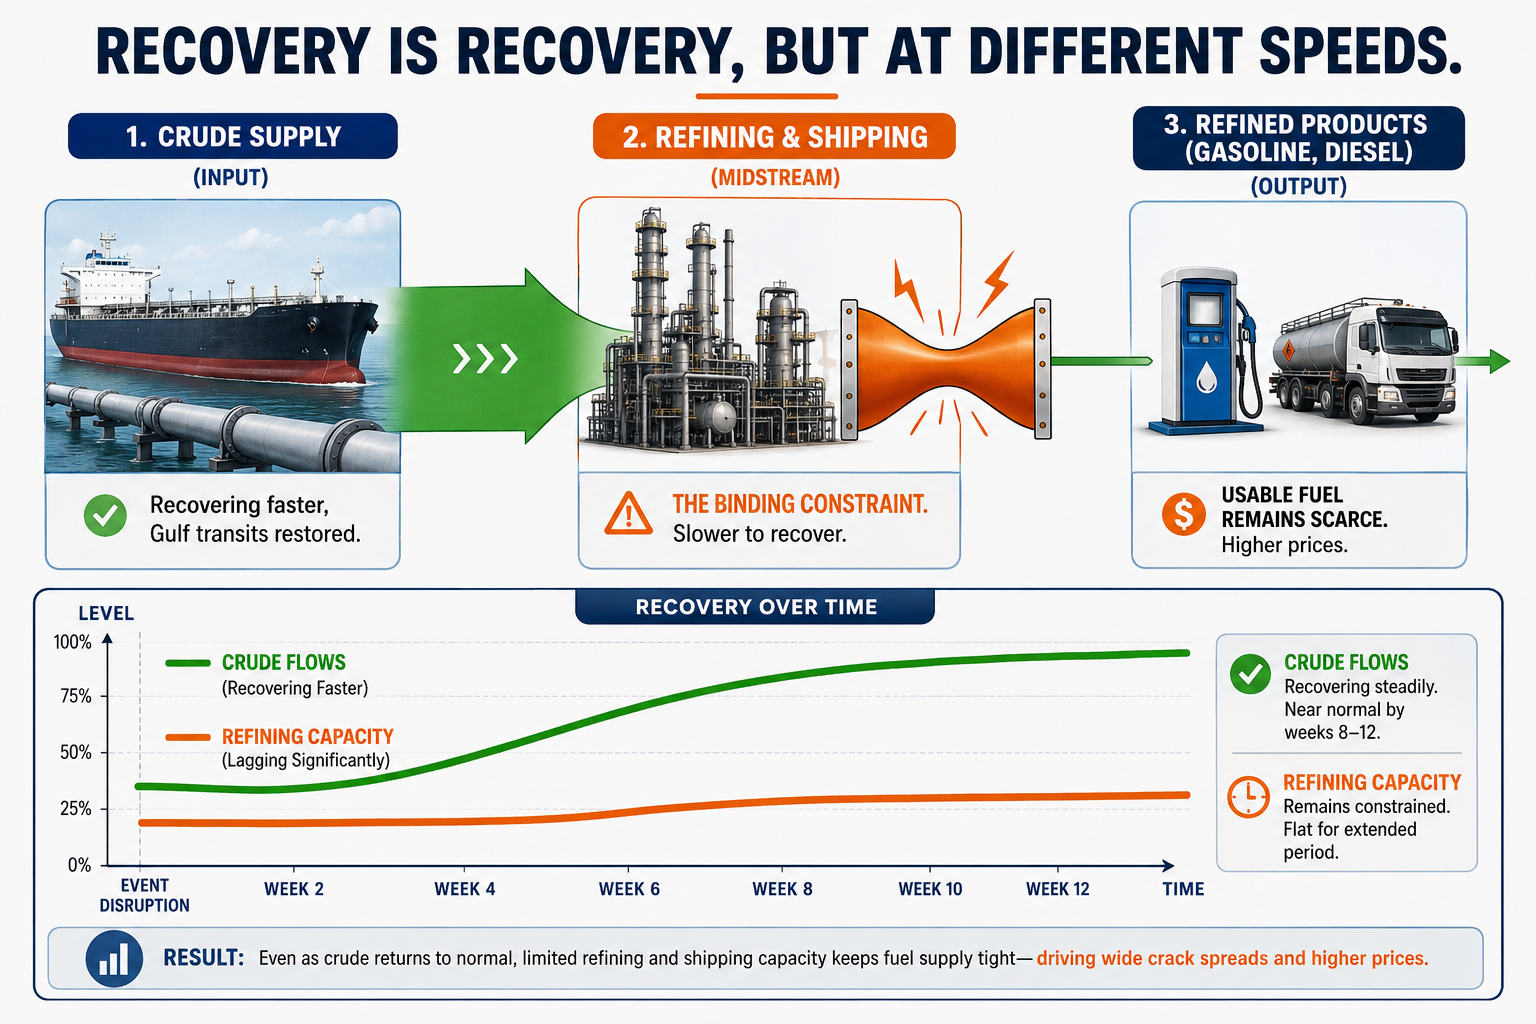
Crude and products told opposite stories at the same time. Crude prices fell through June as Gulf transits recovered — while refining margins and product cracks hit four-year highs in early July, because refineries and product shipping recovered far more slowly than crude exports did.
The ripple — how one shock becomes four different signals
Here is where most commentary goes wrong. It treats "the oil market" as one thing with one price. It is not. It is a supply chain, and a shock does not hit it all at once — it ripples through it, stage by stage, and each stage speaks a different language.
Follow the wave:
A supply shock (a Hormuz scare, a refinery outage) → crude flows get disrupted at the wellhead and the strait → shipping lags — a tanker leaving the Gulf still needs five to seven weeks to land → refining becomes the bottleneck: crude arrives before the plants can turn it into fuel → products (gasoline, diesel) go scarce → crack margins spike → hub inventories draw down as the system scrambles → Cushing hits tank bottom → the spot spread inverts — U.S. barrels command a scarcity premium → and only then does the expectations layer — crude futures — reprice, and even that prices what traders think comes next, not what is scarce now.
One shock. Four layers, four clocks. They do not agree because they are not answering the same question — one reads expectations, one reads refined-fuel supply, one reads physical barrels at the hub, one reads the world-vs-U.S. gap. Read only the crude price and you are watching the last domino while the first three have already fallen.
Supported interpretation — what the facts add up to
So the market has not been following the wrong story. It has been following one layer of a multi-layer one.
Crude futures read the expectations layer — they priced partial flow restoration and a coming surplus (the IEA's base case has the global balance swinging back to oversupply by year-end). Product prices and inventories read the physical layer — where usable fuel was genuinely scarce because refining, not crude, was the binding constraint. Both were telling the truth. They were answering different questions.
That one distinction dissolves every "contradiction" that fueled this year's dramatic oil takes. Crude falling on bullish headlines is not a hidden hand — it is the expectations layer pricing consequences instead of drama. Strong gasoline margins during a historic demand contraction are not secret proof that demand is fine — they are proof that refined supply fell even faster. When two labeled instruments disagree, the correct response is to read both — not to invent a story that forces them to agree.
So, the full answer to the question in the title:
Yes — demand destruction happened. Historically severe, measured, and dated. But most of it is temporary compression from shortage and price, not permanent loss — which is exactly why both major agencies forecast a 2027 rebound. The durable story of 2026 is not demand at all. It is a supply system — production, shipping, refining, storage — knocked down hard and recovering at four different speeds.
Open questions — stated as questions, because that is what they are
Does the recovery hold if hostilities re-escalate? The July 7–8 ceasefire breach showed how fast the expectations layer can reprice — crude rallied roughly 25% off its early-July low inside two weeks. Does Cushing rebuild before the next stress test, or does the system re-enter a squeeze with the thinnest buffers since 1983? And does the redirection of sanctioned flows harden into durable energy blocs?
That last one is a legitimate scenario worth tracking — and it is not a conclusion, because no public evidence yet distinguishes it from the simpler account: governments pulling every lever they have during a crisis. A scenario stays a scenario until the data promotes it. That is not caution for its own sake. It is the line between analysis and a story you'd like to be true.
What the board reads today
This is the part that matters, and it is why the ripple diagram above is not a metaphor — it is the instrument panel, live.
On Macro Lens this morning, all three oil sensors read exactly what a four-layer story predicts once a shock has finished propagating through the chain — the physical layers first, and now the expectations layer too:
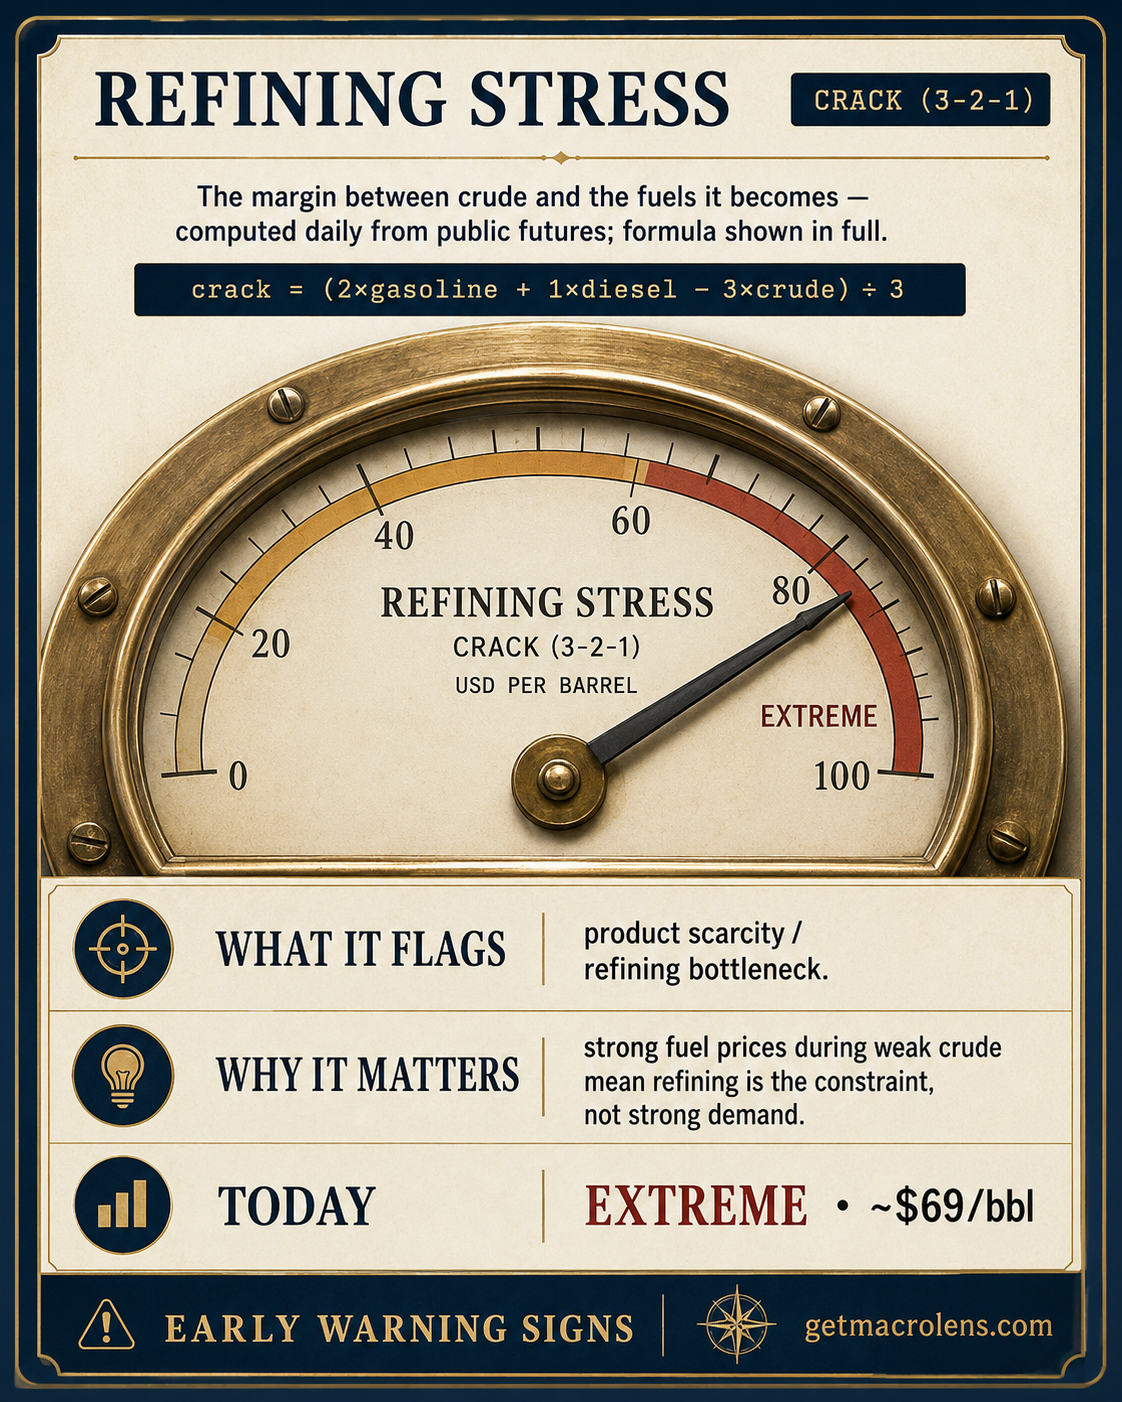
- Refining stress (the 3-2-1 crack) reads EXTREME. The refining layer is flashing — finished fuel scarce relative to crude, margins at the top of their five-year range.
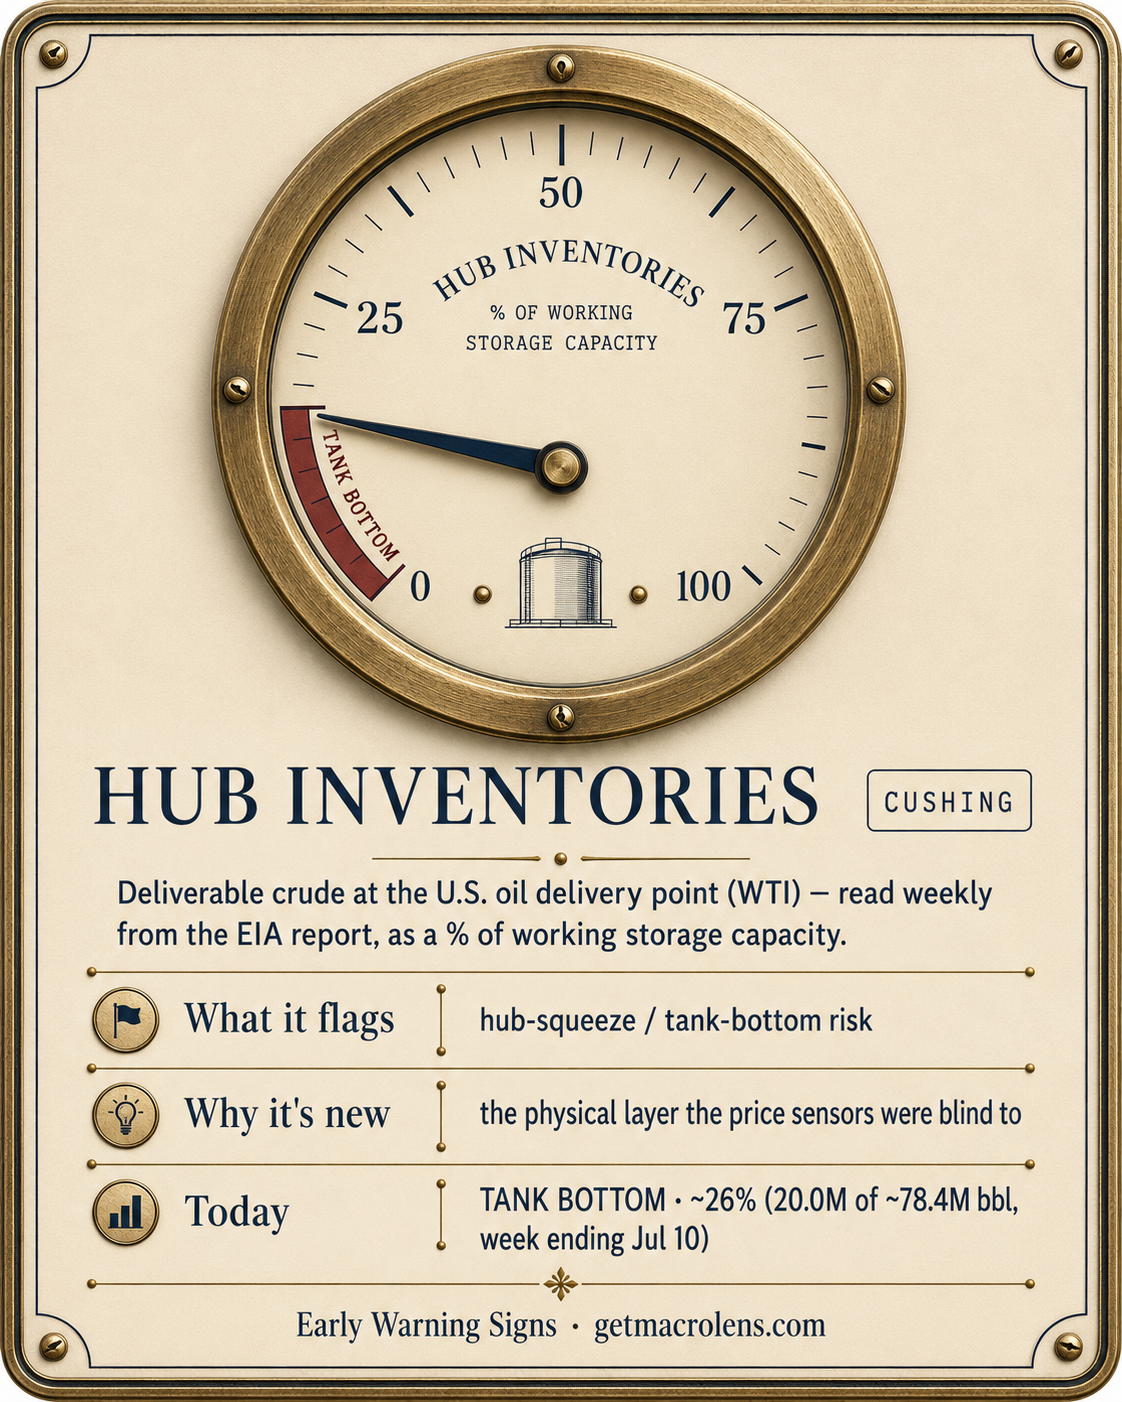
- Hub inventories (Cushing, % of working capacity) reads TANK BOTTOM. The physical layer is flashing — deliverable barrels near the operational floor.
- Oil supply shock (Brent–WTI) reads STRESSED. On July 21 the world-vs-U.S. gap widened past its calibrated boundary and held its three-session dwell — the expectations layer finally catching up to what the physical layers had shown for weeks. No story was needed: a defined threshold on disclosed public data crossed, held, and the state changed, with the flip dated on the sensor's own history (July 21) and a sub-type reading seaborne-supply threat.
No story was needed to catch any of this. Three defined thresholds on disclosed, free public data — all three now crossed and held — each state change dated on its own record. When a gap between layers appears, the systematic answer is another labeled instrument — never a bigger narrative. Two of those instruments (hub inventories, refining stress) went live on the board this week, from the same free public data as everything else. The physical layer the price sensors were blind to now has its own gauges. And they are the two that are already red.
That is the whole difference between a method and a narrative. A narrative needs the market to be hiding something. A method just needs the market to be measured.
The part nobody tells you (and why it's fixable)
Everything above — the IEA and EIA balances, the Cushing tank-bottom math, the crack spread, the Brent–WTI inversion — is read every morning on trading floors off a Bloomberg terminal that costs about $32,000 a year, by desks with a staff macro economist on payroll at $100,000+, or sold to you by a wealth advisor charging 1% of everything you have, every year, forever. Three price tags. All three sell the same thing: a calibrated read of where the market actually is.
The uncomfortable truth is that the data stopped being scarce decades ago. What's scarce is calibration — reading the same public signals the same way every day, without ego, without recency bias, without the urge to make it dramatic. That is exactly the work a disciplined instrument does better than a tired human, and it no longer requires a terminal or a team.
Macro Lens is that instrument, in your palm, for free. Thirteen sensors — six rotation ratios, three macro dials, and four physical-market sensors (oil price, supply shock, hub inventories, refining stress) — read every morning off free public data, calibrated by a deterministic engine, and translated into one plain-English call. The same public signals, the same calibration discipline the desks pay for — in five minutes, for the price of nothing. Not because we're generous. Because the cost of doing it finally collapsed, and someone should hand the result to the people who were never allowed in the room.
You still make the decisions. We just make sure you make them knowing which way the water is moving underneath.

Read today's board at GETMACROLENS.COM.
Calm. Calibrated. Ahead of the wave.
Macro Lens is a financial publication. Nothing herein constitutes investment advice. Past performance does not guarantee future results. Sources for all observed facts: IEA Oil Market Report (June & July 2026); EIA This Week in Petroleum (July 16, 2026); EIA Weekly Petroleum Status Report; EIA Short-Term Energy Outlook (July 2026); DOE SPR weekly data. Board readings are the live Macro Lens sensor states as of July 21, 2026, and update daily.
Update, September 10, 2026: Seven weeks on, the record has been checked sensor by sensor against the dated flip history. The supply shock reading above held on live futures data through August 4, stepped back to normal on August 5, and has read stressed again since August 12; the two physical sensors never left their red states. The follow-up, with every claim checked against its source, is The Needle Was in the Red on July 22. Seven Weeks Later, It Still Is..
Get the five-minute brief every weekday morning.
Free, forever. Calm by default — plain English, no jargon, no urgency.
Macro Lens is a financial publication, not investment advice. Nothing herein is a recommendation to buy or sell any security. The methodology is published and reproducible from public data.